STILLWATER, OKLAHOMA, November 19 — There was a bit of everything at the NCAA Men’s XC Championships.
In brief, Northern Arizona won its third straight team title while Stanford soph Charles Hicks was the individual champ, but as always with the hill-and-dale sport, there are stories behind the headlines.
For instance, there was something routine with NAU cementing its reputation as a generational program, with this win its sixth in seven years. The Flagstaff school is now tied with Oregon for No. 4 on the list of team champs.
There’s always something new at this meet. This time it was British-born (and US/UK dual citizen) Charles Hicks taking the win in 28:43.6, the first by a Stanford runner in that school’s storied harrier history and, given the pedigree of those who’ve run there, an indication of how tough it is to win.
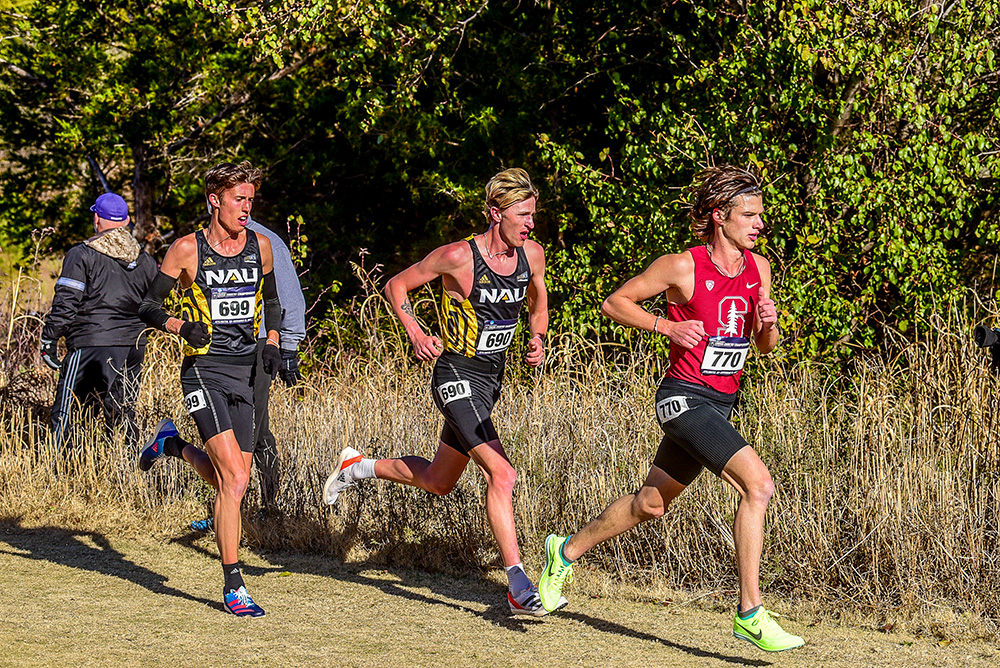
He took the measure, barely, of NAU’s duo of soph Nico Young (28:44.5) and junior Drew Bosley (28:58). Rounding out the top 5 were Dylan Jacobs, the Notre Dame NCAA 10K champ now running for Tennessee, and Oklahoma State’s Alex Maier.
There was also a rarity: a numerical tie for the team title between NAU and host Oklahoma State; the former scored its 83 points off an adjusted 2-3-18-24-36 finish and the latter totaled the same off a 5-8-11-29-30 placing.
With that deadlock, the NCAA tie-breaking rule (each team’s runner vs. the corresponding finisher, with the best of 5 getting the big trophy) ruled the day, giving NAU a 3–2 edge. It was the second tie score in the 84 times the meet has been contested, but in ’42, with no tiebreaker in place, Indiana and Penn State shared the title with 57 points.
BYU ended up 3rd (132), top-ranked Stanford was 4th (190) and Wake Forest 5th (204) in the 31-team field.
There was also something kind of epic — and sort of cool as well — with the top 3 also the wire-to-wire top 3. The get-out-quickly-from-the-get-go race strategy planned by NAU was executed to perfection by the Lumberjack duo and the Stanford rival, who had the rest of the field running for 4th almost before you knew it.
Hicks was content to move along with Young and Bosley, with all sharing the lead at various times through the first 9K. They went through the halfway point in 14:16 with the chase pack well back at 14:27. Hicks said he noticed on the first loop the NAU pair were really strong on the downhills, but he’d pass them a bit on the uphills.
“I kept that in the back of my mind, and it started happening again on the second loop. And it didn’t hurt that much,” Hicks said. “So I started thinking I might be able to lay the hammer down. I cranked up the intensity just a bit to test them out. When I ended up in front, I had to kind of commit at that point.” That came with the end in sight as Bosley dropped a tad and Young struggled to counter Hicks’s move.
“I prefer to run strong, run aggressive, and keep a high intensity over the whole race,” Hicks said. “So they allowed me to run that kind of race I love to run where we’re just going for it, it comes down to who has more fitness, who’s done more miles, and who wants it more.”
The NAU guys moving hard early in the race caused Hicks’s race plan to largely go by the boards right away, but it also made it exactly the kind of race he had hoped for: hard from the start.
It was also just the kind of race that NAU coach Mike Smith wanted from his guys. “People talk about how tough the course is and I believe that makes them run much more conservatively,” he said. “Early in the race, some will play it safe, so that was our game plan. We wanted to capitalize on how much everyone was cautious. We wanted them to follow the plan and not let their nerves deter them.”
“I felt like there was no option but to keep to the plan,” said Young, who notched his second top-4 finish in 3 tries. “No one went with us so it just kind of ended up that way. When he broke away from both of us, I still had it in me to go with him, and I tried my best to, but I certainly didn’t know what was going to happen, because I was very tired at that point.
“I think the downhills more than anything kind of destroy your legs. Each hill takes a lot more out of you because of how taxing it is on your muscles. It’s hard to decide what to do on the downhills but we were taught to run on them.”
Having run here in the ’20 NCAA (Young placed 4th in that March ’21 race), he felt much better prepared: “This time I was in a much better place, knowing the course. I’m definitely learning. It’s increased my experience in championship races.”
The race sequence bears him out. Young and Bosley were never out of the top 3 after 1K. Santiago Prosser, NAU’s third man in 19th, was never lower than 32nd while fourth runner Brodey Hasty, who was 25th, was no lower than 44th and fifth man George Kusche’s worst place was his 39th at the end. The consistency paid off as NAU’s team score was 101 at the 1K mark and in the 90s until its final score.
Oklahoma State had a different approach with 276 points at the first K mark but then steadily diminishing numbers as its top 5 moved up steadily, especially after 5K when the Cowboys overtook Stanford and BYU en route to their tie with history.
“The guys hit it absolutely out of the park,” OSU’s Dave Smith said. “They did exactly what we said to do down to a letter, and it couldn’t have been run more perfectly. We said if we can get to 90 points or under 100, we’re going to win. It’s pretty rare to lose with 83 points.”
NCAA XC MEN’S RESULTS
Stillwater, Oklahoma, November 19 —
Teams
(adjusted places)
| 1. | Northern Arizona | 2-3-18-24-36 (79-127) | 83 |
| 2. | Oklahoma State | 5-8-11-29-30 (50-117) | 83 |
| 3. | BYU | 7-20-28-33-44 (45-49) | 132 |
| 4. | Stanford | 1-10-48-67-69 (101-162) | 195 |
| 5. | Wake Forest | 19-21-25-53-86 (99-144) | 204 |
6. Wisconsin 212; 7. Air Force 264; 8. Colorado 281; 9. Tulsa 304; 10. North Carolina 323; 11. NC State 334; 12. Syracuse 340; 13. Gonzaga 400; 14. Washington 422;
15. Notre Dame 450; 16. Oregon 465; 17. Harvard 474; 18. Texas 506; 19. Villanova 513; 20. Tennessee 517; 21. Butler 553; 22. Virginia 557; 23. Arkansas 584;
24. Mississippi 598; 25. Montana State 599; 26. Utah State 618; 27. Alabama 683; 28. Colorado State 704; 29. Michigan 708; 30. Princeton 712; 31. Georgetown 752.
Individuals
†=not in team scoring
10,000m (255 started, 252 finished)
| 1. | **Charles Hicks’ | Stanford-GB | 28:43.6 |
| 2. | **Nico Young | Northern Arizona | 28:44.5 |
| 3. | *Drew Bosley | Northern Arizona | 28:55.9 |
| 4. | Dylan Jacobs | Tennessee | 28:58.0 |
| 5. | *Alex Maier | Oklahoma State | 28:58.2 |
| 6. | **Graham Blanks | Harvard | 28:58.4 |
| 7. | *Casey Clinger | BYU | 28:58.7 |
| 8. | Isai Rodriguez | Oklahoma State | 28:59.9 |
| 9. | **Parker Wolfe | North Carolina | 29:00.4 |
| 10. | **Ky Robinson’ | Stanford-Aus | 29:07.4 |
| 11. | †**Dylan Schubert | Furman | 29:07.5 |
| 12. | ***Fouad Messaoudi’ | Oklahoma State-Mor | 29:10.8 |
| 13. | Brian Fay’ | Washington-Ire | 29:11.0 |
| 14. | Aaron Bienenfeld’ | Oregon-Ger | 29:12.2 |
| 15. | Cormac Dalton’ | Tulsa-Ire | 29:16.0 |
| 16. | *Jackson Sharp’ | Wisconsin-Aus | 29:16.8 |
| 17. | Barry Keane’ | Butler-Ire | 29:18.0 |
| 18. | **Carter Solomon | Notre Dame | 29:18.8 |
| 19. | **Santiago Prosser | Northern Arizona | 29:19.5 |
| 20. | Zach Facioni’ | Wake Forest-Aus | 29:21.0 |
| 21. | Brandon Garnica | BYU | 29:21.7 |
| 22. | **Luke Tewalt | Wake Forest | 29:22.5 |
| 23. | **Shay McEvoy’ | Tulsa-Ire | 29:25.7 |
| 24. | **Patrick Kiprop’ | Arkansas-Ken | 29:27.1 |
| 25. | *Brodey Hasty | Northern Arizona | 29:27.2 |
| 26. | *Aaron Las Heras’ | Wake Forest-Spa | 29:27.8 |
| 27. | *Haftu Knight | Texas | 29:27.9 |
| 28. | Ryan Johnson | Air Force | 29:28.0 |
| 29. | †Ryan Martins | Loyola-Chicago | 29:28.8 |
| 30. | **Davin Thompson | BYU | 29:28.8 |
| 31. | **Victor Shitsama’ | Oklahoma State-Ken | 29:29.0 |
| 32. | **Rory Leonard | Oklahoma State | 29:29.1 |
| 33. | **Yaseen Abdalla | Tennessee | 29:29.7 |
| 34. | **Bob Liking | Wisconsin | 29:30.2 |
| 35. | **Creed Thompson | BYU | 29:30.5 |
| 36. | Austin Vancil | Colorado | 29:33.3 |
| 37. | †**Kirami Yego’ | South Alabama-Ken | 29:34.2 |
| 38. | Ian Shanklin | NC State | 29:34.5 |
| 39. | George Kusche’ | Northern Arizona-SA | 29:34.9 |
| 40. | *Matthew Richtman | Montana State | 29:35.7 |
| 41. | Yacine Guermali | Gonzaga | 29:36.3 |
| 42. | **Luke Houser | Washington | 29:37.8 |
| 43. | Andrew Kent | Colorado | 29:37.8 |
| 44. | Isaac Akers’ | Tulsa-GB | 29:40.4 |
| 45. | **Rowen Ellenberg | Wisconsin | 29:40.9 |
| 46. | *Nathan Lawler | Syracuse | 29:41.4 |
| 47. | Christian Allen | BYU | 29:42.0 |
| 48. | **Aidan Troutner | BYU | 29:43.1 |
| 49. | Ethan Marshall | Air Force | 29:45.4 |
| 50. | *Acer Iverson | Harvard | 29:46.1 |
| 51. | **Devin Hart | Stanford | 29:47.0 |
| 52. | **Joey Nokes | BYU | 29:48.2 |
| 53. | **Ryan Schoppe | Oklahoma State | 29:48.7 |
| 54. | Charlie Wheeler’ | Wisconsin-GB | 29:49.1 |
| 55. | Anthony Camerieri | Mississippi | 29:49.3 |
| 56. | Thomas Vanoppen’ | Wake Forest-Bel | 29:49.4 |
| 57. | Sam Gilman | Air Force | 29:49.4 |
| 58. | Paul O’Donnell | Syracuse | 29:50.3 |
| 59. | **Wil Smith | Gonzaga | 29:50.4 |
| 60. | Tom Brady | Michigan | 29:51.1 |
| 61. | Michael Power | Tulsa | 29:51.3 |
| 62. | **Ethan Strand | North Carolina | 29:51.8 |
| 63. | ***Izaiah Steury | Notre Dame | 29:52.3 |
| 64. | **Brett Gardner | NC State | 29:52.3 |
| 65. | †*Nickolas Scudder | Charlotte | 29:52.3 |
| 66. | **Victor Kiprop’ | Alabama-Ken | 29:52.5 |
| 67. | Duncan Hamilton | Montana State | 29:52.6 |
| 68. | Seth Hirsch | Colorado | 29:53.4 |
| 69. | Charlie Sweeney | Colorado | 29:53.8 |
| 70. | *Luke Combs | Air Force | 29:55.4 |
| 71. | Meika Beaudoin-Rousseau | Stanford | 29:57.2 |
| 72. | John Tatter | North Carolina | 29:58.2 |
| 73. | †Marcelo Rocha | Providence | 29:58.2 |
| 74. | †**Gable Sieperda | Iowa State | 29:59.0 |
| 75. | **Thomas Boyden | Stanford | 29:59.7 |
| 76. | *Hannes Burger | NC State | 30:00.1 |
| 77. | **Bryce Lentz | Air Force | 30:01.7 |
| 78. | †Tyler Berg | Columbia | 30:02.2 |
| 79. | **Jack Meijer’ | Wisconsin-GB | 30:02.3 |
| 80. | **Ian Harrison | NC State | 30:02.9 |
| 81. | Nathan Henderson | Syracuse | 30:04.6 |
| 82. | Noah Carey | Syracuse | 30:04.9 |
| 83. | **Evan Bishop | Wisconsin | 30:05.6 |
| 84. | †*Abdirizak Ibrahim | New Mexico | 30:05.8 |
| 85. | *Yonas Mogos | Utah State | 30:06.3 |
| 86. | Brendan Fraser | Colorado | 30:06.9 |
| 87. | †*Vincent Mauri | Arizona State | 30:08.3 |
| 88. | Ryan Raff | Northern Arizona | 30:08.6 |
| 89. | †**Ryan Kinnane | Auburn | 30:09.5 |
| 90. | †Jake Ritter | Cal Poly SLO | 30:09.8 |
| 91. | *Sean Maison | Air Force | 30:10.0 |
| 92. | **Liam Murphy | Villanova | 30:10.2 |
| 93. | †Fearghal Curtin’ | Florida State-Ire | 30:10.6 |
| 94. | James Gormley | Oregon | 30:10.9 |
| 95. | **Isaac Alonzo | Texas | 30:11.0 |
| 96. | †Alexander Korczynski | Northeastern | 30:11.1 |
| 97. | †**Gabriel Sanchez | Indiana | 30:11.3 |
| 98. | **Eliud Kipsang’ | Alabama-Ken | 30:11.6 |
| 99. | **Jack Jennings | Villanova | 30:11.8 |
| 100. | Joaquin Martinez De Pinillos | Wake Forest | 30:11.9 |
| 101. | James Mwaura | Gonzaga | 30:12.4 |
| 102. | †***Victor Kibiego’ | UTEP-Ken | 30:12.7 |
| 103. | *Jake Renfree | Notre Dame | 30:13.7 |
| 104. | Isaac Green | Washington | 30:13.8 |
| 105. | *Derek Johnson | Virginia | 30:14.7 |
| 106. | **Will Coogan | North Carolina | 30:16.5 |
| 107. | †Titus Winders | Iowa State | 30:16.9 |
| 108. | *Eli Bennett | Air Force | 30:18.0 |
| 109. | †*Rhys Hammond | Cornell | 30:19.0 |
| 110. | ***Sam Lawler | Syracuse | 30:19.6 |
| 111. | ***James Overberg | Colorado | 30:20.4 |
| 112. | Robinson Snider | NC State | 30:20.7 |
| 113. | **Patrick Anderson | North Carolina | 30:21.0 |
| 114. | *Connor Nisbet | Princeton | 30:21.2 |
| 115. | **Hunter Appleton | Colorado | 30:21.2 |
| 116. | Ben Mitchell | Wake Forest | 30:21.3 |
| 117. | **Daniel O’Brien | Princeton | 30:21.4 |
| 118. | **Cole Sprout | Stanford | 30:22.9 |
| 119. | **Jesse Hamlin | Butler | 30:23.7 |
| 120. | †*Zach Kinne | Duke | 30:23.8 |
| 121. | ***Marco Langon | Villanova | 30:24.5 |
| 122. | †*Teagan Flanagan | South Alabama | 30:25.2 |
| 123. | ***Assaf Harari | Syracuse | 30:25.2 |
| 124. | †Perry Mackinnon | Cornell | 30:25.6 |
| 125. | *Camren Todd | Utah State | 30:25.6 |
| 126. | †**Baidy Ba | Kent State | 30:26.1 |
| 127. | Dereck Elkins | Mississippi | 30:26.1 |
| 128. | Cullen McEachern | Gonzaga | 30:26.7 |
| 129. | ***Will Anthony | Virginia | 30:26.7 |
| 130. | Charlie O’Donovan’ | Villanova-Ire | 30:26.8 |
| 131. | **Abdinasir Hussein | Oregon | 30:27.4 |
| 132. | **Parker Stokes | Georgetown | 30:27.8 |
| 133. | **Kyle Radosevich | Gonzaga | 30:27.8 |
| 134. | †Ibrahim Kedir | La Salle-Can | 30:28.3 |
| 135. | *Marshall Williamson | North Carolina | 30:28.5 |
| 136. | ***Justin Wachtel | Virginia | 30:28.7 |
| 137. | †Antonio López Segura’ | Virginia Tech-Spa | 30:30.3 |
| 138. | *Cruz Gomez | Texas | 30:30.6 |
| 139. | *Myles Richter | Arkansas | 30:31.0 |
| 140. | ***Will Muirhead | Oklahoma State | 30:31.4 |
| 141. | *Mason Brown | Colorado State | 30:31.6 |
| 142. | *Quinn Gallagher | Notre Dame | 30:33.2 |
| 143. | **Wes Porter | Virginia | 30:33.4 |
| 144. | *Tom Oates | Colorado State | 30:34.0 |
| 145. | **Rodger Rivera | Texas | 30:35.1 |
| 146. | **Quincy Norman | Oregon | 30:35.7 |
| 147. | *Max Wehrli | Utah State | 30:35.7 |
| 148. | **Yasin Sado | Virginia | 30:36.2 |
| 149. | †George Wheeler’ | Lamar-GB | 30:36.4 |
| 150. | Sean Laidlaw | Georgetown | 30:37.0 |
| 151. | ***Colin Sahlman | Northern Arizona | 30:37.0 |
| 152. | **Joe Ewing | Harvard | 30:37.3 |
| 153. | *Zach Stewart | Michigan | 30:37.8 |
| 154. | *Matthew Scrape | Syracuse | 30:37.8 |
| 155. | ***Ben Shearer | Arkansas | 30:37.9 |
| 156. | ***Shane Brosnan | Harvard | 30:39.0 |
| 157. | †**Lachlan Wellington | Iona | 30:39.3 |
| 158. | Mark Crandall | Utah State | 30:40.6 |
| 159. | Cooper West | Montana State | 30:41.7 |
| 160. | Josh Phillips’ | Villanova-Aus | 30:42.2 |
| 161. | Arjun Jha | Michigan | 30:42.7 |
| 162. | *Alex Slenning | Oregon | 30:43.1 |
| 163. | ***Gary Martin | Virginia | 30:43.6 |
| 164. | **Joe Waskom | Washington | 30:44.4 |
| 165. | **Matthew Forrester | Butler | 30:44.6 |
| 166. | Cole Bullock | Mississippi | 30:45.5 |
| 167. | **Will Minnette | Butler | 30:45.6 |
| 168. | Ed Trippas | Washington | 30:46.0 |
| 169. | †*Bradley Makuvire’ | Tulane-Zim | 30:46.4 |
| 170. | ***Rynard Swanepoel’ | Wake Forest-SA | 30:46.6 |
| 171. | **Sam Affolder | Washington | 30:46.7 |
| 172. | †*Aden Smith | Michigan State | 30:46.9 |
| 173. | †CarLee Stimpfel | Michigan State | 30:46.9 |
| 174. | †Marquette Hanson | Missouri | 30:47.1 |
| 175. | Jacob McLeod | Arkansas | 30:47.8 |
| 176. | *Jacob Lewis | Tennessee | 30:47.9 |
| 177. | Chris Maxon | Mississippi | 30:48.2 |
| 178. | **Camden Gilmore | Georgetown | 30:48.9 |
| 179. | *Dawson Besst | Colorado State | 30:49.0 |
| 180. | **Aiden Britt | Mississippi | 30:51.5 |
| 181. | Karl Thiessen | Tennessee | 30:51.8 |
| 182. | *Jack McMahon | Butler | 30:52.3 |
| 183. | ***Myles Hogan | Princeton | 30:53.0 |
| 184. | Rohann Asfaw | Virginia | 30:53.1 |
| 185. | *Haftu Strintzos’ | Villanova-Aus | 30:53.9 |
| 186. | **Lars Mitchel | Colorado State | 30:54.4 |
| 187. | *Thomas Chaston | Colorado State | 30:54.5 |
| 188. | ***Adam Spencer’ | Wisconsin-Aus | 30:54.8 |
| 189. | **Abraham Avila-Martinez | Texas | 30:56.8 |
| 190. | ***Vivien Henz | Harvard | 30:57.1 |
| 191. | **Evan Burke’ | Stanford-Can | 30:57.4 |
| 192. | †*Isaac Basten | Drake | 30:58.0 |
| 193. | †*Victor Neiva | North Texas | 30:58.3 |
| 194. | Ben Fleming | North Carolina | 30:58.6 |
| 195. | †**Luke Henseler | Pitt | 30:59.2 |
| 196. | ***Edouard Morin-Luzuy’ | Butler-Fra | 30:59.6 |
| 197. | †Jonathan Shields’ | Boise-GB | 31:00.9 |
| 198. | *Jacob Wiggers | Alabama | 31:01.2 |
| 199. | *Carter Cheeseman | Notre Dame | 31:02.0 |
| 200. | **Ben Perrin | Montana State | 31:02.4 |
| 201. | **Elias Schreml’ | Arkansas-Ger | 31:04.6 |
| 202. | *Malte Propp’ | Tulsa-Ger | 31:04.9 |
| 203. | *Riley Moore | Gonzaga | 31:05.5 |
| 204. | †*Jack Miller | Pitt | 31:06.6 |
| 205. | David Melville | Harvard | 31:06.6 |
| 206. | *Joshua Zelek | Princeton | 31:07.5 |
| 207. | Ryan Murphy | Arkansas | 31:08.5 |
| 208. | ***Cameron Stein | Oregon | 31:09.1 |
| 209. | **Hillary Cheruiyot’ | Alabama-Ken | 31:09.3 |
| 210. | **Matthew Rizzo | Georgetown | 31:10.0 |
| 211. | **Leo Daschbach | Washington | 31:11.5 |
| 212. | ***Josh Edwards | Oregon | 31:12.6 |
| 213. | **Brennan Benson | Utah State | 31:13.1 |
| 214. | Caleb Garnica | Utah State | 31:17.3 |
| 215. | **Michael Mooney | Colorado State | 31:17.9 |
| 216. | **Ryan Adkins | Butler | 31:18.6 |
| 217. | *Nate Kawalec | Tennessee | 31:19.3 |
| 218. | Darren Harman | Utah State | 31:21.0 |
| 219. | Shane Bracken’ | Mississippi-Ire | 31:24.9 |
| 220. | ***Bryce Cerkowniak | Gonzaga | 31:26.3 |
| 221. | †*Dennis Kipngeno’ | A&M-Corpus Christi-Ken | 31:27.9 |
| 222. | *Matthew Carmody | Notre Dame | 31:29.1 |
| 223. | ***Luke Lambert | Tulsa | 31:29.8 |
| 224. | *Jack Stanley | Princeton | 31:30.4 |
| 225. | ***Lucas Guerra | Georgetown | 31:31.1 |
| 226. | ***Luke Venhuizen | Michigan | 31:31.4 |
| 227. | **Jake Toomey | NC State | 31:34.4 |
| 228. | ***Nathanael Berhane | Texas | 31:35.2 |
| 229. | **Eli Nahom | Tennessee | 31:37.0 |
| 230. | **Oli Raimond’ | Michigan-Aus | 31:37.4 |
| 231. | Kevin Berry | Notre Dame | 31:38.2 |
| 232. | *Brady Grant | Alabama | 31:38.8 |
| 233. | **Levi Taylor | Montana State | 31:44.5 |
| 234. | Nick Foster | Michigan | 31:51.6 |
| 235. | Jack Fredian | Villanova | 31:55.2 |
| 236. | *Max Nores | Tulsa | 31:56.0 |
| 237. | ***Emmanuel Sgouros | Texas | 31:58.2 |
| 238. | *Jack Spamer | Michigan | 31:58.6 |
| 239. | †*Taonga Mbambo | La Salle | 32:04.0 |
| 240. | **Owen Smith | Montana State | 32:04.0 |
| 241. | **Gavin Saacke | Alabama | 32:05.1 |
| 242. | **Rob McManus | Montana State | 32:08.7 |
| 243. | *Josh Shearer | Arkansas | 32:08.8 |
| 244. | *Riley Buchholz | Tennessee | 32:09.0 |
| 245. | Dalton Hengst | Mississippi | 32:11.8 |
| 246. | **Jarrett Kirk | Princeton | 32:12.7 |
| 247. | *Brock Dykema | Colorado State | 32:15.8 |
| 248. | **John Malach | NC State | 32:17.0 |
| 249. | **Brady Barton | Alabama | 32:30.2 |
| 250. | **Abel Teffra | Georgetown | 32:32.6 |
| 251. | **Ben Rosa | Harvard | 32:45.1 |
| 252. | †**Jonathan Chung | Texas A&M | 32:50.7 |
…dnf—*Shea Weilbaker (Georgetown), *Nicholas Russell (Santa Clara), **Anthony Monte (Princeton).