IN MANY WAYS 2020 became a lost year for international track & field—but still it turned out an extraordinary record year for one event category: long distance running on the track.
Because 2020 provided almost a “Grand Slam” in World Records as new top marks were achieved in the 5000, 10,000 and 1-Hour for men as well as the 5000 and Hour for women. It might even have been a complete set of new records if Sifan Hassan’s 10,000 attempt in Hengelo had not been thwarted by really bad weather.
What makes this record avalanche extra exceptional is the fact that all the previous marks had withstood challenges for quite some time: Tirunesh Dibaba’s 14:11.15 and Dire Tune’s 18,517m since ’08, Haile Gebrselassie’s 21,285m since ’07, Kenenisa Bekele’s 26:17.53 since ’05 and his 12:37.35 since ’04.
One major answer could be that with no global championship athletes were able to focus wholeheartedly on record chasing. However, that theory is in conflict with the fact that all the standing records mentioned above actually were set in years where there were either Olympic Games (’04 & ’08) or World Championships (’05 and ’07).
What could then explain why 2020 became such a record year for the distance runners?
The first answer that comes to mind is of course the new shoe technology. There is no doubt that the new shoes give an advantage—because otherwise World Athletics would not have found it necessary to first issue new detailed rules in January and then in July further tighten them for track running.
However, we still don’t really know the magnitude of the advantage the new shoes are going to have on track running as it wasn’t until this summer that these shoes left the prototype stage and became available on the market.
However, there was also another new tool available to the record hungry long distance runners in ’20: the Wavelight System, which consists of light emitters positioned along the curb of the oval. These emitters could be programmed to provide a “moving light wave” at any pace asked for.
The idea as such is not at all new (the ITA pro league, for example, used lights as far back as ’73). However, it still had not previously been used in federation-sanctioned track running for the very simple reason that it was explicitly forbidden in the WA rules (144.3):
“… the following examples shall be considered assistance and are therefore not allowed: (a) Pacing in races by persons not participating in the same race, by athletes lapped or about to be lapped or by any kind of technical device.”
This rule is actually still in force but last year the WA Council added the following paragraph under section 144.4, (Assistance Allowed): “For the purpose of this Rule, the following shall not be considered assistance, and are therefore allowed:
“Electronic lights or similar appliance indicating progressive times during a race, including of a relevant record.”
As the old rule against “pacing… by any kind of technical device” remains intact it appears that the “moving lights” device was viewed by the decision-makers as mainly a new service for the spectators (on-site and via TV) and not as an assistance of any significance to the athletes.
A new information tool to help spectators better understand and appreciate the efforts of the athletes was also given as the reason for the rule amendment by WA President Sebastian Coe when asked about the new technology at a press conference in October.
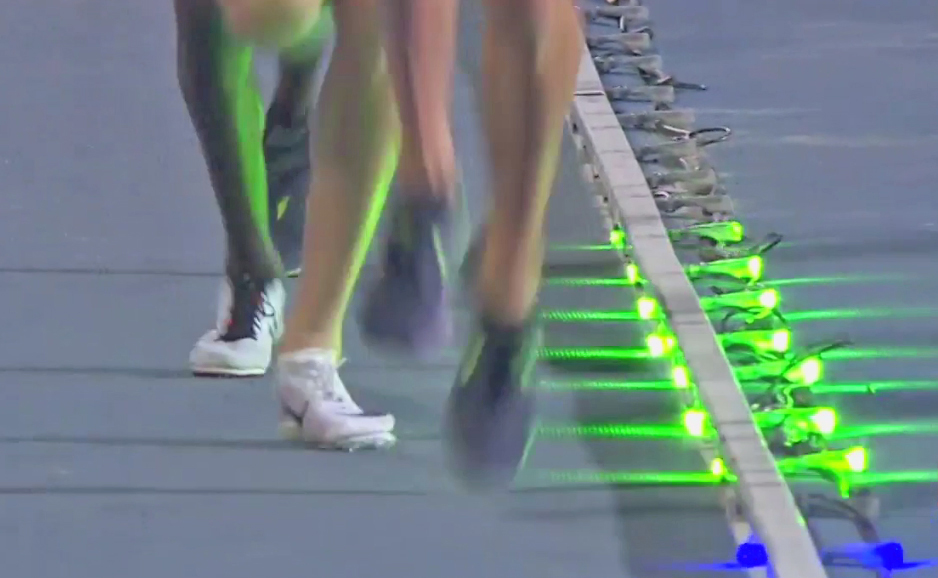
Furthermore this view was indirectly echoed by the English-speaking commentators on the international broadcast from the WR meet in Valencia as they discussed whether the athletes during the race really could see the moving lights so well that they could take in and act upon the visual pace information provided (see photo).
Whether the athletes in Valencia were indeed ”assisted”—and if so to which extent—by the moving lights can be analyzed by comparing the splits en route to the old and new records.
Following find a chart listing (almost) all 200-meter splits for Bekele in his 26:17.53 WR and for Cheptegei in his 26:11.00 WR. The splits have mainly been determined by frame-by-frame analysis of the race videos and are accurate to the 10th. A few splits are missing for the simple reason that the official video at those moments didn’t show the record runner.
Please observe that these splits from start to finish are for Bekele and Cheptegei personally, i.e. not for the pacemakers leading in the early stages. So the times are not identical to the official splits issued which were for the leading runner.
Also note that the official splits for Cheptegei’s laps 23 and 24 were simply wrong: the official clock stopped about 1.5 seconds early at 9200m and the erratic 62.92—61.73—63.87 official version for laps 22-23-24 in reality was a well balanced 63.0—63.2—62.4.
| Cheptegei | Bekele | differential | Cheptegei | Bekele | Cheptegei | Bekele | |
| 200 | 32.4 | ? | — | 32.4 | ? | — | — |
| 400 | 64.0 | 62.5 | +1.5 | 31.5 | ? | 64.0 | 62.5 |
| 600 | 1:35.3 | ? | — | 31.3 | ? | ||
| 800 | 2:07.0 | 2:08.2 | -1.2 | 31.7 | ? | 63.0 | 65.7 |
| 1000 | 2:38.8 | 2:40.6 | -1.8 | 31.8 | 32.4 | ||
| 1200 | 3:10.0 | 3:12.5 | -2.5 | 31.2 | 31.9 | 63.0 | 64.3 |
| 1400 | 3:41.5 | 3:42.1 | -0.6 | 31.5 | 29.6 | ||
| 1600 | 4:12.9 | 4:13.2 | -0.3 | 31.4 | 31.1 | 62.9 | 60.7 |
| 1800 | ? | ? | — | ? | ? | ||
| 2000 | 5:15.7 | 5:16.4 | -0.7 | ? | ? | 62.8 | 63.2 |
| 2200 | ? | ? | — | ? | ? | ||
| 2400 | 6:18.8 | 6:19.5 | -0.7 | ? | ? | 63.1 | 63.1 |
| 2600 | 6:50.3 | 6:50.6 | -0.3 | 31.5 | 31.1 | ||
| 2800 | 7:21.9 | 7:21.8 | +0.1 | 31.6 | 31.2 | 63.1 | 62.3 |
| 3000 | 7:53.4 | 7:53.3 | +0.1 | 31.5 | 31.5 | ||
| 3200 | 8:24.5 | 8:24.3 | +0.2 | 31.1 | 31.0 | 62.6 | 62.5 |
| 3400 | 8:55.6 | 8:55.5 | +0.1 | 31.1 | 31.2 | ||
| 3600 | 9:27.0 | 9:27.0 | 0.0 | 31.4 | 31.5 | 62.5 | 62.7 |
| 3800 | 9:58.6 | 9:58.3 | +0.3 | 31.6 | 31.3 | ||
| 4000 | 10:30.3 | 10:30.4 | -0.1 | 31.7 | 32.1 | 63.3 | 63.4 |
| 4200 | 11:01.8 | 11:01.3 | +0.5 | 31.5 | 30.9 | ||
| 4400 | 11:33.2 | 11:33.0 | +0.2 | 31.4 | 31.7 | 62.9 | 62.6 |
| 4600 | 12:04.8 | 12:04.7 | +0.1 | 31.6 | 31.7 | ||
| 4800 | 12:36.3 | 12:36.7 | -0.4 | 31.5 | 32.0 | 63.1 | 63.7 |
| 5000 | 13:08.0 | 13:09.4 | -1.4 | 31.7 | 32.7 | ||
| 5200 | 13:39.3 | 13:39.9 | -0.6 | 31.3 | 30.5 | 63.0 | 63.2 |
| 5400 | 14:10.6 | 14:11.1 | -0.3 | 31.3 | 31.2 | ||
| 5600 | 14:42.1 | 14:41.9 | +0.2 | 31.5 | 30.8 | 62.8 | 62.0 |
| 5800 | 15:13.7 | 15:13.0 | +0.7 | 31.6 | 31.1 | ||
| 6000 | 15:45.1 | 15:44.7 | +0.4 | 31.4 | 31.7 | 63.0 | 62.8 |
| 6200 | 16:16.7 | 16:16.6 | +0.1 | 31.6 | 31.9 | ||
| 6400 | 16:48.0 | 16:48.7 | -0.7 | 31.3 | 32.1 | 62.9 | 64.0 |
| 6600 | 17:19.3 | 17:20.4 | -1.1 | 31.3 | 31.7 | ||
| 6800 | 17:50.6 | 17:52.3 | -1.7 | 31.3 | 31.9 | 62.6 | 63.6 |
| 7000 | 18:22.0 | 18:24.0 | -2.0 | 31.7 | 31.7 | ||
| 7200 | 18:53.5 | 18:56.7 | -3.2 | 31.5 | 32.7 | 62.9 | 64.4 |
| 7400 | 19:25.1 | 19:28.3 | -3.2 | 31.6 | 31.6 | ||
| 7600 | 19:56.5 | 20:00.6 | -4.1 | 31.4 | 32.3 | 63.0 | 63.9 |
| 7800 | 20:28.0 | 20:32.7 | -4.7 | 31.5 | 32.1 | ||
| 8000 | 20:59.5 | 21:04.6 | -5.1 | 31.5 | 31.9 | 63.0 | 64.0 |
| 8200 | 21:30.9 | 21:38.5 | -7.6 | 31.4 | 33.9 | ||
| 8400 | 22:02.4 | 22:09.0 | -6.6 | 31.5 | 30.5 | 62.9 | 64.4 |
| 8600 | ? | 22:40.8 | ? | 31.8 | |||
| 8800 | 23:05.4 | 23:13.1 | -7.7 | ? | 32.3 | 63.0 | 64.1 |
| 9000 | 23:36.8 | 23:45.1 | -8.3 | 31.4 | 32.0 | ||
| 9200 | 24:08.6 | 24:17.1 | -8.5 | 31.8 | 32.0 | 63.2 | 64.0 |
| 9400 | 24:39.7 | 24:48.5 | -8.8 | 31.1 | 31.4 | ||
| 9600 | 25:11.0 | 25:20.5 | -9.5 | 31.3 | 32.0 | 62.4 | 63.4 |
| 9800 | 25:41.0 | 25:49.8 | -8.8 | 30.0 | 29.3 | ||
| 10000 | 26:11.00 | 26:17.53 | -6.53 | 30.0 | 27.8 | 60.0 | 57.1 |
The most telling columns are those for the half laps. Cheptegei had 47 out of 50—all but the first and the last two—at 31-point while Bekele’s portions Nos. 2–48 varied between 29.6 and 33.9.
That’s a pattern that appears counterintuitive as Bekele had experience running at that low-26:00 pace (improved his own WR by less than 3 seconds) while Cheptegei entered completely new territory pacewise (lowered PR by 37 seconds!).
Quite a lot of record setters have over the years been described as ”metronomic” runners. However, if you break down the races into laps or half-laps like above one could always see quite significant variations like those for Bekele above.
As a picture is said to say more than a thousand words a graph illustrating the lap times 1–25 for Cheptegei and Bekele probably is the best way to demonstrate how differently those two record performances came about.
In the graph the 0-line indicates their respective average lap time and the plus-values designate slower laps and the minus-values faster laps (in seconds).
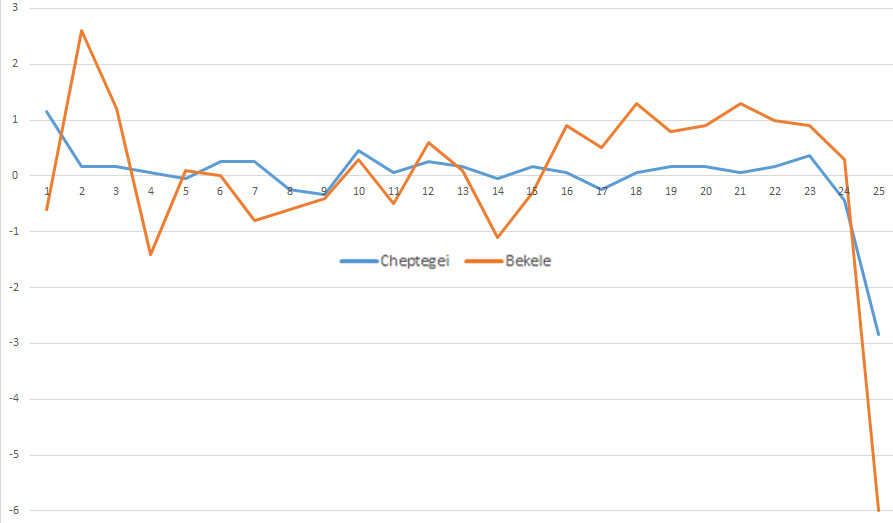
So except for laps 1 and 25 Cheptegei never was more than half a second off his average and actually 19 of 25 laps fell within ± 0.3 of his average. His standard deviation for laps 2–24 was an astonishingly low 0.21.
Bekele, on the other hand, got for example 65.7 on lap 2 and 60.7 on lap 4 and ended up with a standard deviation for laps 2–24 of 1.00 s, i.e. almost 5X larger than Cheptegei’s.
Still, Bekele was just as aware as Cheptegei that the smartest way to set at a record is to quickly settle into and then keep an even pace throughout the race. But still he—who indeed had an aura of ”the perfectly tuned running machine”—even in his fastest WR race didn’t have any success in keeping a truly even pace.
Why? The simple answer is that also the very best are only humans and keeping running at exactly the same speed is more or less impossible—without assistance. Actually Bekele’s record race followed a very traditional pattern:
A slightly overambitious human pacemaker starts out too fast, then realizes that and slows down a little bit too much. Thus it takes a few laps to settle into the right rhythm. Then at the end of his mission the last pacemaker tires slightly so that when he steps off the track the protagonist actually feels the need to speed up.
But running alone he after a while—due to increasing tiredness combined with the monotony—begins to slow down gradually until he realizes it is just a couple of laps left which rejuvenates him and he finishes with a last-lap sprint.
You can see this ebb-and-flow-pattern reflected in the variation of the splits for kilometers Nos. 2–9 during the 17 WR runs from Ron Clarke’s 27:39 in ’65 (first to break the 28:00 barrier) to Bekele’s 26:17 in ’05:
| athlete | WR | year | fastest/slowest | diff |
| Clarke | 27:39.4 | ’65 | 2:43.5/2:50.0 | 6.5 |
| Viren | 27:38.35 | ’72 | 2:41.9/2:52.0 | 10.1 |
| Bedford | 27:30.80 | ’73 | 2:43.4/2.48.4 | 5.0 |
| Kimobwa | 27:30.47 | ’77 | 2:41.7/2:47.3 | 5.6 |
| Rono | 27:22.4 | ’78 | 2:42.1/2:51.0 | 7.9 |
| Mamede | 27:13.81 | ’84 | 2:41.8/2:46.6 | 4.8 |
| Barrios | 27:08.23 | ’89 | 2:41.9/2:45.9 | 4.0 |
| Chelimo | 27:07.91 | ’93 | 2:41.1/2:45.1 | 4.0 |
| Ondieki | 26:58.38 | ’93 | 2:39.6/2:45.0 | 5.4 |
| Sigei | 26:52.23 | ’94 | 2:39.7/2:45.1 | 5.4 |
| Geb | 26:43.53 | ’95 | 2:38.2/2:43.0 | 4.8 |
| Hissou | 26:38.08 | ’96 | 2:35.5/2:43.1 | 7.6 |
| Geb | 26:31.32 | ’97 | 2:37.1/2:40.6 | 3.5 |
| Tergat | 26:27.85 | ’97 | 2:36.0/2:40.7 | 4.7 |
| Geb | 26:22.75 | ’98 | 2:37.6/2:41.4 | 3.8 |
| Bekele | 26:20.31 | ’04 | 2:36.5/2:40.8 | 4.3 |
| Bekele | 26:17.53 | ’05 | 2:35.8/2:40.6 | 4.8 |
| Cheptegei | 26:11.00 | ’20 | 2:36.9/2:37.7 | 0.8 |
It is amazing how similar those spreads were from Clarke to Bekele despite the fact that the list contains 17 records by 14 men and that the record during that 40-year period was lowered by more than 1:20.
If one excludes Viren’s record—which was set in a championship final and not in a designated record attempt—the median is 4.8, the minimum 3.4 and the maximum 7.9.
So it was really a completely new paradigm we experienced when Cheptegei ran his 26:11.00 assisted by the previously prohibited moving lights technology: his spread was a mere 0.8—just a sixth of the median for the records set during the preceding 55 years.
Thus it is certainly not an understatement to say that the effect of the new technology on the new world record performance was profound. Rather it constituted what best could be described as a revolution.
Tomorrow: Part II

